Excel is a powerful tool that is widely used for data management, analysis, and visualization. If you are new to Excel, understanding the basics is essential to unlock its full potential. This comprehensive guide will walk you through the fundamental concepts of Excel, providing a solid foundation for beginners.
Understanding the Excel Interface
The Excel interface consists of various components that help you navigate and interact with the software effectively. These include the Ribbon, which contains commands organized into tabs; the Worksheet, where you enter and manipulate data; and the individual cells, rows, and columns that make up the grid structure of the Worksheet.
Basic Excel Functions
Excel offers a wide range of functions that allow you to perform calculations, format data, and automate tasks. Some of the basic functions include entering data in cells, formatting cells to enhance readability, using formulas to perform calculations, and leveraging pre-built functions to analyze data.
Working with Worksheets
Worksheets are the building blocks of an Excel workbook. They allow you to organize and manage data efficiently. In this section, you will learn how to insert and delete worksheets, rename them for clarity, and copy or move them to rearrange your workbook.
Formatting and Styling in Excel
Excel provides several formatting and styling options to make your data visually appealing and easily understandable. Learn how to apply cell styles to format data consistently, utilize themes to give your workbook a unified look, and use conditional formatting to highlight data based on specific conditions.
Data Manipulation in Excel
Efficiently managing and manipulating data is a core feature of Excel. Discover how to sort data in ascending or descending order, filter data based on specific criteria, and work with tables to analyze, sort, and filter data more effectively.
Charts and Graphs
Excel’s charting capabilities allow you to present data visually, making it easier to understand and interpret trends. Learn how to create different types of charts, customize chart elements to improve clarity, and format and edit charts to achieve the desired visual representation.
Common Mathematical Functions
Excel provides a range of mathematical functions that enable you to perform complex calculations easily. Explore common mathematical functions such as sum, average, max, min, and count, as well as text functions for manipulating text data and logical functions to evaluate conditions and make decisions.
Advanced Excel Features
Once you have mastered the basics, you can delve into advanced features that can streamline your workflow and enhance productivity. Learn about pivot tables for analyzing large datasets, data validation to ensure data accuracy, conditional formulas to perform calculations based on specific conditions, and macros to automate repetitive tasks.
Tips and Tricks for Excel Efficiency
To excel in Excel, it’s helpful to know some tips and tricks that can boost your efficiency and productivity. Discover useful shortcuts, time-saving techniques, and hidden features that will make your Excel experience smoother and more enjoyable.
By mastering the basics of Excel, you will gain the skills and confidence to work with data effectively, perform calculations, visualize data, and automate tasks. Whether you are a student, professional, or business owner, Excel proficiency is a valuable asset that can open up a world of possibilities for data analysis and decision-making.
Understanding the Excel Interface
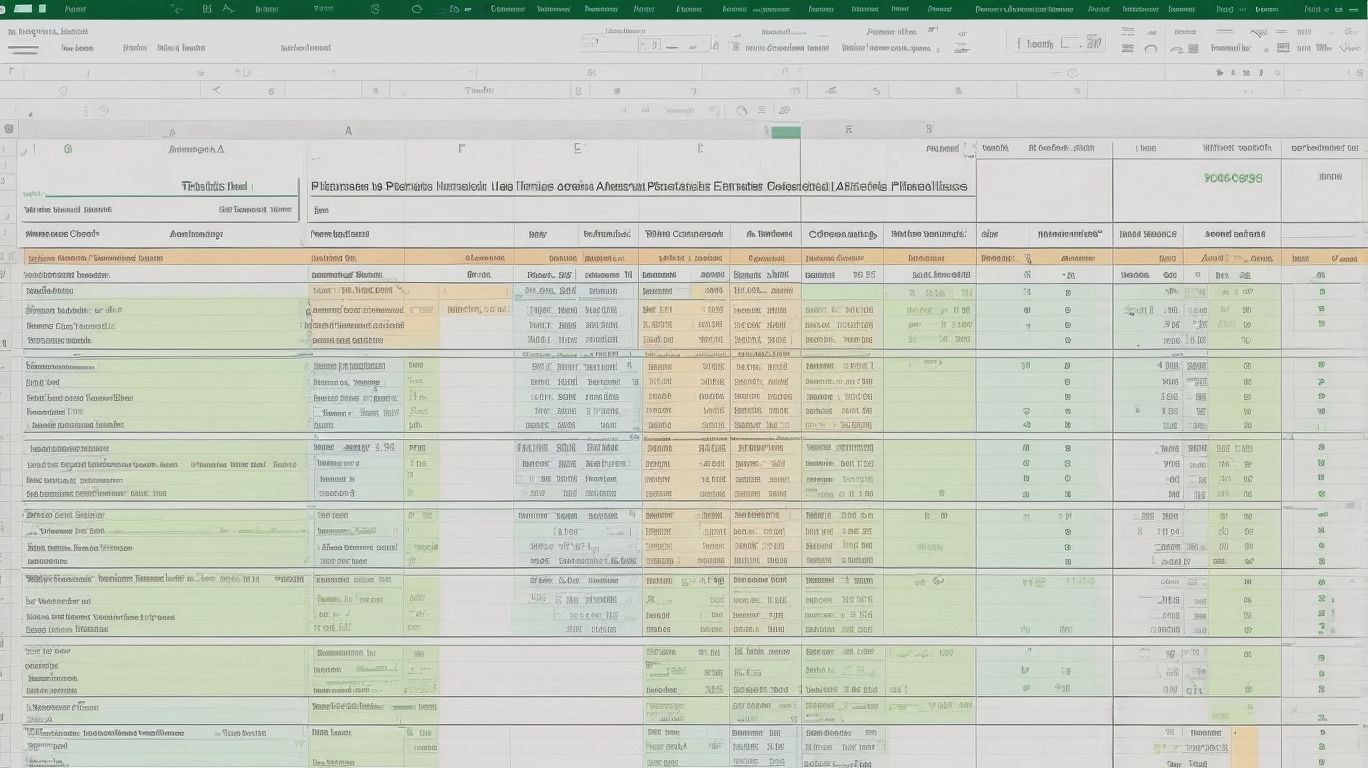
Photo Credits: Exceladept.Com by William Walker
Understanding the Excel Interface is essential for novices to effectively navigate and utilize the software. The ribbon, which contains various tabs and commands, and the workbook, where data is organized into worksheets, are key elements of the Excel interface. The formula bar enables users to input and edit formulas, while the cell grid provides a visual representation of data in cells. Becoming familiar with these interface components will empower users to easily perform tasks such as data entry, formatting, and basic calculations. By grasping the Excel interface, beginners can confidently explore the software and leverage its capabilities to their advantage.
Basic Excel Functions
Photo Credits: Exceladept.Com by Joshua White
Learning basic Excel functions is crucial for beginners to effectively navigate and utilize the software.
- Sum Function: Utilize the “=SUM()” formula to add up a range of cells or numbers.
- Average Function: Utilize the “=AVERAGE()” formula to calculate the average of a range of cells or numbers.
- Count Function: Apply the “=COUNT()” formula to count the number of cells in a range that contains numbers.
Excel, developed by Microsoft, was first released in 1985 and quickly gained popularity as a spreadsheet program due to its user-friendly interface and extensive capabilities. Over the years, it has evolved by incorporating more advanced functions, making it a powerful tool for data analysis, financial modeling, and project management.
Working with Worksheets
Photo Credits: Exceladept.Com by Nathan Hall
Working with worksheets in Excel is a fundamental skill that beginners must master. So, here are the necessary steps to get started with worksheets:
- Begin by opening Excel and creating a new workbook.
- Navigate to the “Insert” tab in order to add a fresh worksheet.
- To move between worksheets, simply click on the sheet tabs located at the bottom of the screen.
- If you want to rename a worksheet, just double-click on the sheet tab and enter a new name.
- Should you wish to move a worksheet, you can effortlessly click and drag the sheet tab to your preferred location.
- Deleting a worksheet is also straightforward; just right-click on the sheet tab and select “Delete”.
Pro-tip: Save time by using shortcut keys such as Ctrl+PageUp and Ctrl+PageDown for quickly navigating between worksheets.
Remember, becoming proficient in working with worksheets in Excel is a vital skill that will greatly assist you in efficiently organizing and analyzing your data.
Formatting and Styling in Excel

Photo Credits: Exceladept.Com by Ronald Martinez
In Excel, proper formatting and styling is essential for effectively organizing and visually enhancing spreadsheets. The provided table presents key techniques to take into account when working on your spreadsheets:
| Formatting: |
|---|
| – Cell formatting: Adjust the font, size, color, and alignment of cells. |
| – Number formatting: Control decimal places, currency symbols, and percentages according to your requirements. |
| – Conditional formatting: Apply formatting to highlight cells based on specific criteria. |
| Styling: |
|---|
| – Cell styles: Utilize pre-defined styles to maintain consistency throughout your spreadsheets. |
| – Themes: Modify the overall color schemes and fonts to suit your preferences. |
| – Borders and shading: Enhance the appearance of cells or ranges by adding borders and fill colors. |
By mastering these formatting and styling options in Excel, you will be able to create professional-looking spreadsheets that are not only easy to read but also simple to understand.
Data Manipulation in Excel

Photo Credits: Exceladept.Com by Larry Jones
When it comes to data manipulation in Excel, there are several key techniques that can be utilized to efficiently analyze and organize data. This includes sorting data by specific criteria, filtering data to display only relevant information, and using formulas and functions to perform calculations and manipulate data. Excel provides tools for merging data from different sources, removing duplicates, and cleaning up data inconsistencies. By mastering these techniques, users can effectively manage and manipulate large amounts of data, enabling them to make informed decisions and extract meaningful insights.
| Sorting data |
| Filtering data |
| Using formulas and functions |
| Merging data |
| Removing duplicates |
| Cleaning up data inconsistencies |
Throughout history, the ability to manipulate data has played a crucial role in various fields, from scientific research to business analysis. Excel has revolutionized the way data is handled, providing users with powerful tools to manipulate and analyze data efficiently. This has led to significant advancements in data-driven decision-making and has paved the way for innovation in numerous industries. As technology continues to evolve, so too will the techniques and tools available for data manipulation in Excel, further enhancing our ability to derive valuable insights from complex datasets.
Charts and Graphs

Photo Credits: Exceladept.Com by Dylan Thomas
Creating effective charts and graphs is an essential skill when working with Excel. Charts and graphs are powerful tools for communicating insights and trends in your data. They help visualize data and make it easier to understand and interpret. When creating charts and graphs, consider the type of data being presented and the message you want to convey. Choose the appropriate chart type, such as bar charts for comparing data or line charts for showing trends over time. Use labels, titles, and axis descriptions to provide context to the reader. Make sure your charts and graphs, such as bar charts and line charts, are visually appealing by selecting appropriate colors and formatting options.
Advanced Excel Features
Photo Credits: Exceladept.Com by Richard Wright
Advanced Excel features can significantly enhance your productivity and efficiency when working with spreadsheets. Here are some impressive features to explore:
-
PivotTables: Analyze and summarize large data sets effortlessly.
-
Data Validation: Ensure accuracy and consistency by establishing data entry rules.
-
Conditional Formatting: Highlight important trends and patterns in your data.
-
Advanced Formulas: Utilize functions like VLOOKUP, INDEX-MATCH, and SUMIF to execute complex calculations.
-
Macros: Automate repetitive tasks by recording and running macros.
Consider incorporating these Advanced Excel features into your Excel workflow to elevate your spreadsheet skills. Through practice and exploration, you’ll become an expert in utilizing advanced Excel features. Keep exploring and experimenting with new techniques to maximize your efficiency and productivity in Excel.
Tips and Tricks for Excel Efficiency
Photo Credits: Exceladept.Com by Roger Sanchez
Looking for tips and tricks to enhance your Excel efficiency? You’re in the right place! These essential techniques will help you save time and boost your productivity in Excel:
- Keyboard shortcuts: Master commonly used shortcuts, such as Ctrl+C and Ctrl+V, to swiftly copy and paste data.
- AutoFill feature: Utilize AutoFill to automatically populate a sequence of numbers, dates, or text based on a given pattern.
- Conditional formatting: Draw attention to critical data by applying formatting rules that are based on specific conditions.
- Data validation: Control data entry by specifying valid values or criteria for cells.
- Pivot tables: Gain quick insights and perform in-depth analysis of extensive datasets using pivot tables.
Frequently Asked Questions
FACan Excel macros really automate mundane tasks in Microsoft Excel?
Yes, with the use of VBA macros, Excel can automate repetitive and mundane tasks, saving you time and effort.
FAHow can VBA macros boost productivity in Excel?
VBA macros allow you to automate tasks, eliminating manual work and increasing efficiency, which in turn boosts productivity.
FAAre there any more books similar to “Excel For Beginners: A Comprehensive Guide To Mastering Excel Basics And Beyond”?
Yes, there are several recommended books on Excel and VBA macros that can further enhance your knowledge and skills, such as “Excel VBA Macros For Dummies: Ready-To-Use Examples For Automating Your Work,” “Excel Macros For Dummies,” and more.
FACan Excel help in creating a budget?
Yes, Excel is a powerful tool for budgeting. The book mentioned, “The Excel For Dummies: How To Use The VBA And Tips On Creating A Budget By Excel,” can guide you on utilizing Excel for budgeting purposes.
FAHow can mastering Excel basics help businesses avoid costly mistakes?
By fully understanding Excel and its various features, businesses can minimize errors, leading to cost savings. “Excel For Beginners” aims to provide a comprehensive understanding of Excel to prevent such mistakes.
FACan Excel save businesses millions of dollars?
Yes, by avoiding costly mistakes, businesses can save significant amounts of money. The book “Excel For Beginners” highlights the potential cost savings that come with mastering Excel basics.

