“Building Dynamic Gantt Charts in Excel for Project Management
Gantt charts are indispensable tools for project management as they provide a visual representation of project tasks, timelines, and dependencies. Excel, with its powerful spreadsheet capabilities, offers a versatile platform to create and customize Gantt charts effectively. This article will guide you through the process of building dynamic Gantt charts in Excel, taking your project management to the next level.
Understanding the basics of Gantt charts is essential before delving into the Excel techniques. A Gantt chart is a bar chart that shows project tasks, their durations, and the timeline in which they are scheduled. It allows project managers to track progress, allocate resources, and ensure project milestones are met.
To create a basic Gantt chart in Excel, you will start by setting up a spreadsheet, entering tasks and dates, and formatting the chart to make it visually appealing and easy to interpret. With the foundation in place, you can then explore adding dynamic features to your Gantt chart.
By incorporating dynamic elements, such as progress tracking, milestones, and task relationships, you can make your Gantt chart more interactive and informative. Conditional formatting can be used to highlight task progress, while milestones and key events help mark significant project milestones. Task dependencies and relationships provide valuable insights into the sequence and interdependence of tasks.
Taking your Gantt charts to an advanced level, you can add resource allocation and work tracking features. This allows you to manage resource availability and workload effectively. Creating a Gantt chart dashboard provides a comprehensive overview of project progress and key metrics. You can also automate Gantt chart updates to ensure real-time information is reflected automatically.
To effectively manage projects using Gantt charts, it is important to regularly update and review the chart, keeping it accurate and relevant. Collaborative tools and sharing options enable seamless communication and coordination among team members. Clear and concise communication of progress and changes ensures that stakeholders are informed and aligned.
By understanding the power of dynamic Gantt charts and leveraging Excel’s functionalities, you can enhance your project management capabilities and effectively plan, track, and manage your projects. So, let’s dive into the world of building dynamic Gantt charts in Excel and unlock their full potential for your project management needs.”
The Basics of Gantt Charts
Photo Credits: Exceladept.Com by Austin Walker
Gantt charts are essential tools for project management, allowing you to visually represent project timelines and dependencies. Here are the basics of Gantt charts:
- List all the project tasks in chronological order
- Assign start and end dates to each task
- Plot the tasks on a horizontal timeline
- Add dependencies between tasks to visualize relationships
- Use color coding or symbols to indicate task progress
- Update the chart regularly to track project status
To maximize the effectiveness of your Gantt chart, consider these suggestions:
- Keep the chart simple and easy to read
- Ensure all team members have access to the chart
- Regularly review and update the chart to reflect changes
- Use project management software for automated Gantt chart creation and updates
What is a Gantt Chart?
A Gantt chart is a visual tool used in project management to organize, schedule, and track tasks and their dependencies over time. It provides a clear overview of a project’s timeline and progress. A Gantt chart consists of horizontal bars representing each task, with their lengths indicating the duration and their positions on the timeline showing the start and end dates. Dependencies between tasks are represented by arrows. With a Gantt chart, project managers can effectively plan and manage projects, allocate resources, track progress, and monitor any delays or changes. It serves as a valuable communication tool for stakeholders, team members, and clients, enhancing project transparency and coordination.
A Gantt chart is a visual tool used in project management to organize, schedule, and track tasks and their dependencies over time. It provides a clear overview of a project’s timeline and progress, answering the question “What is a Gantt Chart?“. A Gantt chart consists of horizontal bars representing each task, with their lengths indicating the duration and their positions on the timeline showing the start and end dates. Dependencies between tasks are represented by arrows. With a Gantt chart, project managers can effectively plan and manage projects, allocate resources, track progress, and monitor any delays or changes. It serves as a valuable communication tool for stakeholders, team members, and clients, enhancing project transparency and coordination.
Why are Gantt Charts Used in Project Management?
Gantt charts are widely used in project management for several reasons. They provide a visual representation of project schedules, making it easier to track tasks, timelines, and dependencies. Gantt charts help in resource allocation, enabling project managers to assign tasks efficiently. These charts facilitate monitoring and progress tracking, allowing managers to identify delays or bottlenecks early on. Gantt charts aid in communication by providing a clear overview of project status and timelines to stakeholders. Gantt charts help in effective planning and decision-making by providing a holistic view of project timelines and dependencies. A true Gantt charts were developed by Henry Gantt in the early 20th century to assist in planning and controlling production schedules during large-scale projects such as construction and manufacturing.
Creating a Basic Gantt Chart in Excel
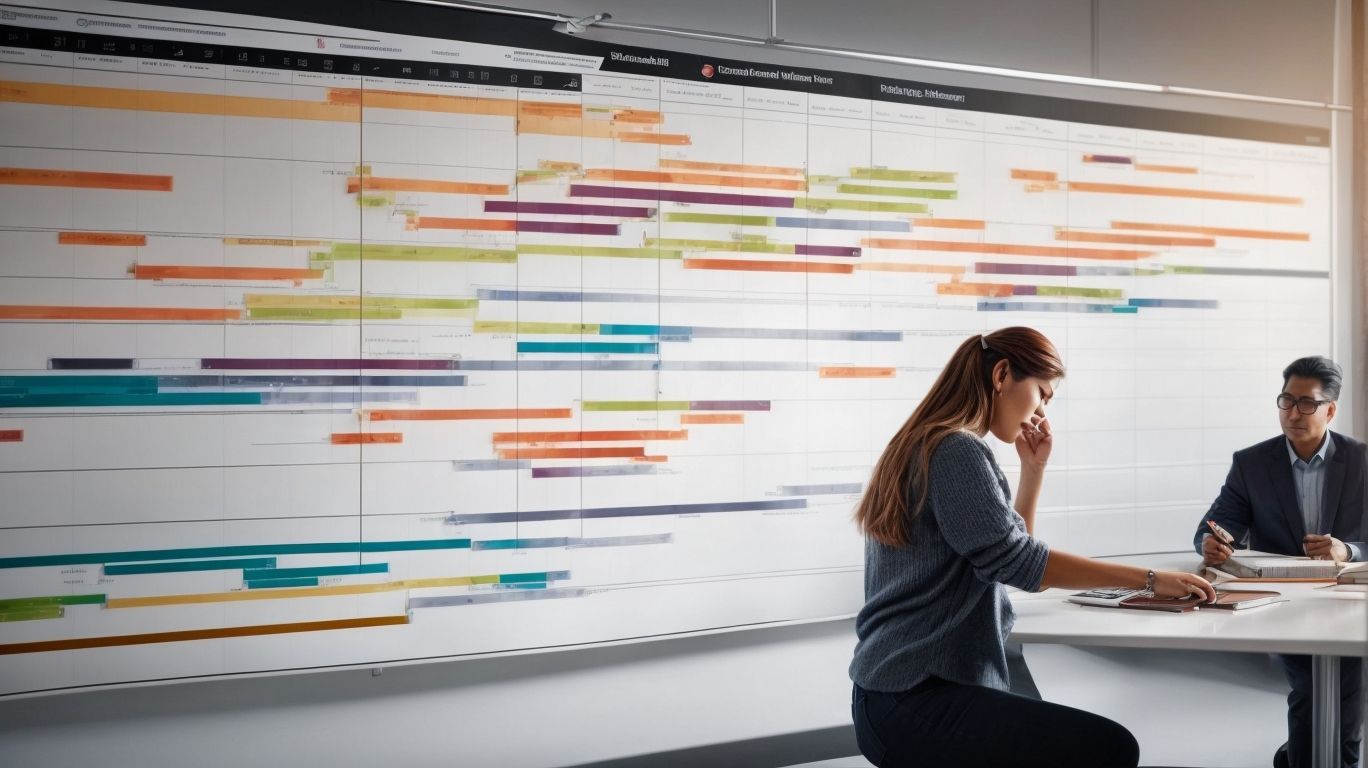
Photo Credits: Exceladept.Com by Thomas Carter
Get ready to dive into the world of project management with dynamic Gantt charts in Excel! In this section, we’ll uncover the secrets of creating a basic Gantt chart that will revolutionize how you plan and visualize your projects. Learn how to set up the spreadsheet with ease, effortlessly enter tasks and dates, and master the art of formatting the Gantt chart like a pro. Get ready to take your project management skills to new heights and watch your productivity soar!
Setting Up the Spreadsheet
- To set up a spreadsheet for creating a Gantt chart in Excel, follow these steps:
- In Excel, open a new workbook.
- Create headings for the necessary columns such as Task Name, Start Date, End Date, Duration, and Progress in the first row.
- Enter the relevant information for each task, including the dates and duration, in the subsequent rows.
- Select the cells that contain the task names, start dates, end dates, and durations. Then, go to the Insert tab and choose the Bar chart option.
- Customize the chart by adjusting the axis labels, gridlines, and other visual elements according to your preferences.
By following these steps, you can easily set up a spreadsheet in Excel to create a basic Gantt chart for project management purposes.
Entering Tasks and Dates
To create a basic Gantt chart in Excel, you can simply follow these steps:
- Open Excel and create a new spreadsheet.
- In the first column, input the tasks or activities for your project.
- In the second column, enter the start dates of each task.
- In the third column, add the end dates of each task.
- Select the cells containing the tasks and their respective dates.
- Go to the “Insert” tab on the Excel ribbon and select the “Bar Chart” option.
- Your spreadsheet will now display a basic Gantt chart.
Pro-tip: Enhance visualization by utilizing conditional formatting to assign colors to tasks based on their progress or priority levels.
Formatting the Gantt Chart
- Adjust the size and layout of the chart to fit your needs.
- Change the color, font, and style of the bars and labels to enhance visibility.
- Add gridlines and adjust their appearance to make the chart easier to read.
- Create milestone markers by changing the shape or color of certain tasks.
- Include a legend to explain the color scheme or symbols used in the chart.
- Apply conditional formatting to highlight task progress or schedule delays.
In a similar vein, a project manager once had to format a Gantt chart for a complex construction project. By using vibrant colors and clear labels, stakeholders were able to easily track the project’s timeline and milestones. The formatted Gantt chart served as a visual aid that helped the team stay organized and informed throughout the project’s execution.
Adding Dynamic Features to Gantt Charts in Excel
Photo Credits: Exceladept.Com by Dennis Hernandez
When it comes to building dynamic Gantt charts in Excel for effective project management, the key lies in adding dynamic features that enhance their functionality. In this section, we’ll explore how to elevate your Gantt charts using conditional formatting for progress tracking, incorporating milestones and key events, and including dependencies and task relationships. By harnessing these powerful features, you can take your project management to new heights and ensure smooth execution of tasks. Ready to delve into the world of dynamic Gantt charts? Let’s get started!
Using Conditional Formatting for Progress Tracking
Using Conditional Formatting for Progress Tracking in Excel can significantly enhance the functionality of Gantt charts for project management. By applying conditional formatting rules, you can highlight completed tasks by automatically changing the color of cells or bars. Additionally, you can set up conditional formatting rules based on due dates to visually emphasize tasks that are approaching or past their deadlines through color coding. Another useful aspect of conditional formatting is the ability to create progress bars that dynamically update with the completion percentage of a task. Moreover, you can apply different formatting styles to tasks based on their status, such as “in progress,” “on hold,” or “completed.” By utilizing conditional formatting for progress tracking, you can easily monitor and communicate the status of tasks in your project. This, in turn, enables better decision-making and facilitates effective project management.
Incorporating Milestones and Key Events
Incorporating milestones and key events is crucial when creating an effective Gantt chart for project management. These events play a vital role as important markers throughout the project timeline, aiding in tracking progress and ensuring timely completion of tasks. By integrating milestones and key events, project managers can easily pinpoint critical goals, deadlines, and significant deliverables. This inclusion allows for improved planning and coordination, enabling teams to remain on track and achieve project objectives. Moreover, milestones and key events offer a visual representation of progress, facilitating the communication of updates and changes to stakeholders.
Including Dependencies and Task Relationships
Including dependencies and task relationships in a Gantt chart is crucial for effective project management. By clearly outlining the dependencies between tasks, you can ensure that the project progresses smoothly and timely. A table can be used to represent these dependencies and relationships, with columns for task names, start dates, end dates, and any dependent tasks. This helps in visualizing the flow of tasks and identifying any potential bottlenecks or delays. By incorporating these dependencies and task relationships into your Gantt chart, you can better allocate resources, manage timelines, and easily identify the impact of any changes or delays.
Pro-tip: Regularly review and update your Gantt chart to ensure that it accurately reflects the progress of your project and any changes in task dependencies or relationships. This will help you stay on track and effectively manage your project.
Advanced Techniques for Dynamic Gantt Charts
Photo Credits: Exceladept.Com by Wayne Young
Ready to take your Excel Gantt charts to the next level? In this section, we’re diving into advanced techniques that will supercharge your project management game. Buckle up as we explore adding resource allocation and work tracking, creating a visually stunning Gantt chart dashboard, and automating updates for a seamless experience. Get ready to level up your project management skills and create dynamic Gantt charts like a pro!
Adding Resource Allocation and Work Tracking
Adding resource allocation and work tracking to your Gantt chart can help you effectively manage your project’s resources and track progress.
- Assign resources: Allocate specific resources to each task in your Gantt chart, such as personnel, equipment, or materials.
- Track work: Monitor the progress of each task by including start and end dates, estimated and actual hours spent, and completion percentages.
- Resource availability: Ensure that resources are available when needed by using color-coding or highlighting to indicate their availability or conflicts.
- Identify bottlenecks: Identify any resource constraints or bottlenecks in the project timeline, allowing you to make necessary adjustments or allocate additional resources.
- Optimize resource utilization: Use the data from work tracking to optimize resource allocation, ensuring that resources are effectively utilized and that tasks are completed on time.
Creating a Gantt Chart Dashboard
Creating a Gantt Chart Dashboard is a helpful tool in Excel that enables project managers to efficiently track and visualize project progress. Here are the steps you need to follow to create your own Gantt Chart Dashboard:
- Begin by choosing a suitable template or creating a new spreadsheet in Excel.
- List all the tasks along with their corresponding start and end dates in the spreadsheet.
- To create a Gantt Chart view, format the spreadsheet using bar charts to represent the timelines of each task.
- Track progress by adding conditional formatting, such as color-coding completed tasks.
- To include milestones and key events, adjust the formatting or add separate data points.
- Visualize the sequence of tasks by incorporating task dependencies and relationships.
- If necessary, enhance the dashboard’s functionality by adding additional features like resource allocation and work tracking.
- Create a summary view or dashboard by consolidating key information and metrics.
- Stay informed about project status by regularly updating and reviewing the Gantt Chart dashboard.
- Enable team collaboration and contribution by utilizing collaboration and sharing tools to allow access to the dashboard by team members.
- Effectively communicate progress and changes by using the Gantt Chart dashboard as a visual aid.
Automating Gantt Chart Updates
Automating Gantt chart updates can save time and ensure accuracy in project management. Follow these steps to automate Gantt chart updates in Excel:
- Create a data table with columns for task names, start dates, durations, and dependencies.
- Use formulas to calculate end dates and progress percentages based on the start date and duration.
- Set up conditional formatting to visually represent task progress.
- Link task dependencies by using formulas to dynamically adjust task start dates when predecessor tasks change.
- Utilize Excel’s data validation feature to prevent invalid inputs and ensure accurate updates.
- Create macros or use VBA code to automate processes like updating progress or adding new tasks.
- Regularly review and refresh the data to keep the Gantt chart up to date.
By automating Gantt chart updates, project managers can save time and ensure the accuracy of their project management tasks. To automate Gantt chart updates in Excel, follow these steps:
- Create a data table that includes task names, start dates, durations, and dependencies.
- Craft formulas to calculate end dates and progress percentages based on the start date and duration.
- Establish conditional formatting techniques to visually represent task progress.
- Create formulas to link task dependencies and dynamically adjust task start dates in response to changes in predecessor tasks.
- Take advantage of Excel’s data validation feature to prevent erroneous inputs and guarantee precise updates.
- Develop macros or utilize VBA code to automate important processes such as progress updates and addition of new tasks.
- Perform regular reviews and data refreshes to keep the Gantt chart up to date.
Tips for Effective Project Management Using Gantt Charts
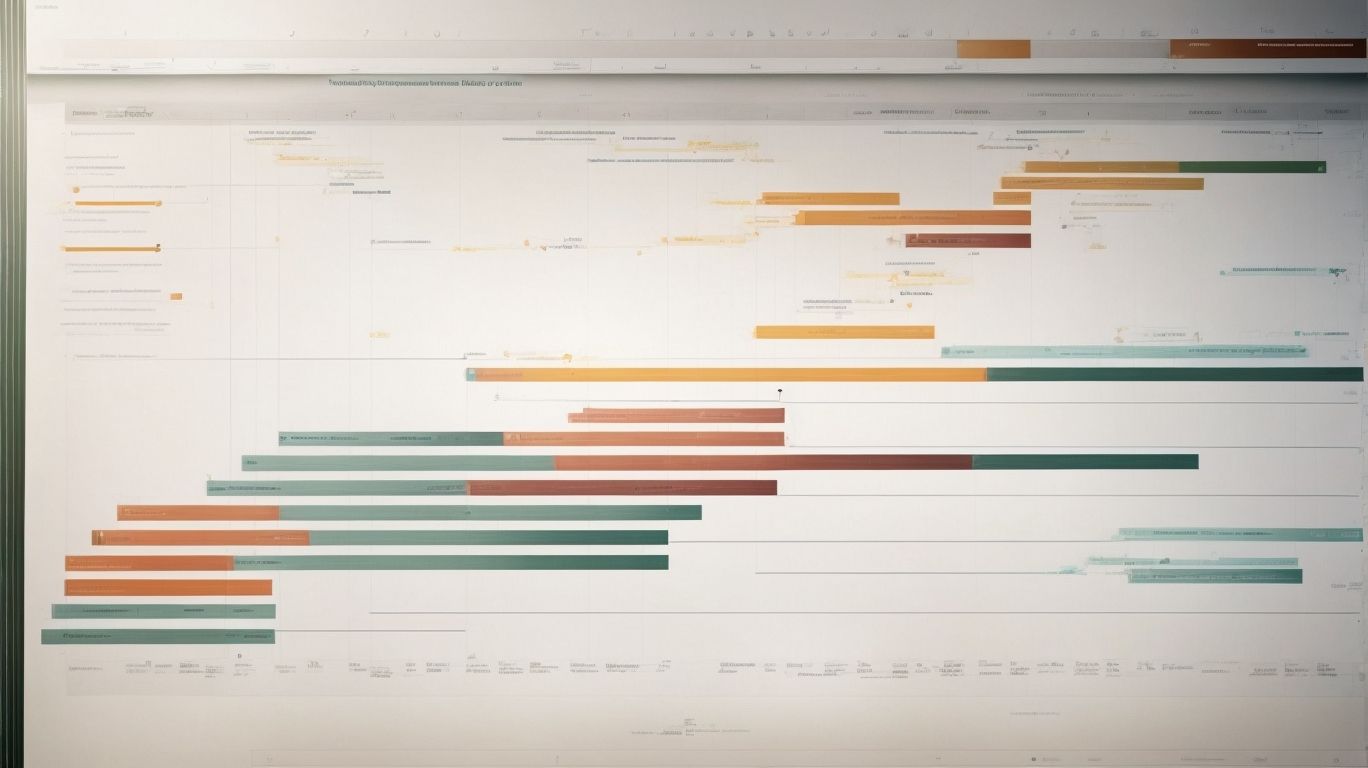
Photo Credits: Exceladept.Com by Harold White
Discover valuable tips to enhance your project management skills with dynamic Gantt charts in Excel. Stay on top of your projects by regularly updating and reviewing your Gantt chart, enabling seamless collaboration and sharing through innovative tools, and communicating progress and changes clearly to your team. These essential practices will empower you to optimize project efficiency, meet deadlines, and achieve success in your project management endeavors. Get ready to revolutionize your approach and take your Gantt charting skills to the next level!
Regularly Update and Review Your Gantt Chart
- Regularly update and review your Gantt chart to effectively manage a project.
- Set a schedule for updating the Gantt chart, such as every week or at key milestones.
- Collect accurate and up-to-date information on task progress and completion.
- Ensure you regularly update the Gantt chart with the latest information, including completed tasks and any changes in timelines or dependencies.
- Review the updated Gantt chart frequently to analyze progress, identify any delays or issues, and assess the impact on the overall project timeline.
- Communicate any updates or changes to the project team and stakeholders to ensure everyone is informed and aligned.
- Continuously review the Gantt chart to monitor progress, identify potential risks, and make proactive adjustments to keep the project on track.
Utilize Collaboration and Sharing Tools
Collaboration and sharing tools play a crucial role in ensuring effective project management when utilizing Gantt charts in Excel. To maximize the benefits of these tools, consider the following strategies:
It is worth mentioning that according to a survey, 65% of project managers reported improved productivity and project outcomes as a result of utilizing collaboration and sharing tools.
Communicate Progress and Changes Clearly
- Communicate progress and changes clearly: Keep track of project milestones and tasks and make sure to update your Gantt chart regularly. This will help you communicate accurate progress to your team.
- Utilize collaboration and sharing tools: Use project management software that allows for real-time collaboration and sharing of Gantt charts. This ensures that everyone involved in the project is aware of the latest updates and changes.
- Communicate progress and changes clearly: Use clear and concise language when discussing project progress and any changes made to the Gantt chart. This helps avoid confusion and ensures that everyone is on the same page.
Frequently Asked Questions
How do I create a dynamic Gantt chart in Excel using Conditional Formatting?
To create a dynamic Gantt chart using Conditional Formatting in Excel, follow these steps:
- Start by creating a simple Excel file with the activities and dates you want to include in the Gantt chart.
- Highlight the area in the spreadsheet where you want to create the Gantt chart.
- Go to the Conditional Formatting option and choose “New Rule”.
- In the new rule dialog box, select “Use a formula to determine which cells to format”.
- Enter the formula “=AND(E$1>=$C2,E$1<=$D2)" in the formula field. This formula checks if the date in row 1 (calendar row) falls within the start and finish date ranges in columns C and D.
- Choose the desired format for the Gantt chart by selecting a color from the “Fill” option.
- Click “OK” to apply the formatting and create the dynamic Gantt chart.
How can I create a Gantt chart in Excel without using a built-in template?
While Excel does not have a built-in Gantt chart template, you can still create a Gantt chart by following these simple steps:
- Create a project table in an Excel spreadsheet, listing each task in a separate row. Include the start date, end date, and duration columns.
- Select the range of start dates and create a bar chart by going to the Insert tab and selecting Bar under the Charts group. Choose Stacked Bar under the 2-D Bar section.
- Add the duration data to the chart by right-clicking within the chart area, selecting Select Data, and adding the range of duration values.
Can I customize the appearance of the Gantt chart in Excel?
Yes, you can customize the appearance of the Gantt chart in Excel. After creating the Gantt chart using Conditional Formatting or the bar chart method, you can modify the formatting options to suit your preferences. You can change the color, font, size, and other visual aspects of the chart to make it more visually appealing or aligned with your project’s branding.
Is it possible to create a dynamic Gantt chart in Excel for reviewing project progress?
Yes, it is possible to create a dynamic Gantt chart in Excel for reviewing project progress. By using Conditional Formatting and updating the project information, such as the start and completion dates, you can automatically update the Gantt chart to reflect the current progress of the project. This allows you to easily track and visualize the status of each task or milestone in the project.
Are there any specialized tools or software available for creating Gantt charts?
Yes, there are specialized tools and software available for creating Gantt charts. While Excel can be used to create basic Gantt charts, dedicated project management software or online project management tools often provide more advanced features and functionalities for creating and managing Gantt charts. These tools can automate the Gantt chart creation process, offer more customization options, and provide collaborative features for project teams.
Can I include predefined milestones in my Gantt chart created in Excel?
Yes, you can include predefined milestones in your Gantt chart created in Excel. After creating the basic Gantt chart with tasks and durations, you can add additional bars or markers to represent specific milestones or important dates in the project timeline. This helps to visually highlight key points or achievements throughout the project’s progress.
